South Africa’s payment system is rapidly evolving, with mobile payments, non-bank service providers, and e-wallets. But is most of the population ready, and willing, to adopt these new methods?
Not quite, according to the findings of the inaugural Payments Study Report published by the South African Reserve Bank (SARB) this month.
The study used two surveys: the Survey of Consumer Payment Choice (SCPC) and the Diary of Consumer Payment Choice (DCPC). The SCPC, a recall-based survey, focused on consumer preferences, awareness of, usage, and barriers to payment adoption. The DCPC tracked payments over several days for three months. Both surveys aimed to represent South Africa’s demographic profile of people aged 18 and older, covering a population of 40.5 million. The SCPC involved more than 3 000 participants nationwide, while the DCPC recorded 210 207 payments from 4 624 participants between June and December 2023, totalling R111.2 million.
Zooming in on digital transformation, the report found that only a third (33%) of the population have no difficulty adopting electronic or digital financial methods. The balance shared a range of reasons they are wary of digital payment methods, including lack of knowledge (19%), lack of funds (17%), lack of control (9%), and external factors such as security concerns, not interested in technology, and scared of these methods.
Although most South Africans still prefer cash as their payment method of choice, irrespective of what they buy, the payments landscape measured through individuals’ payment data shows cash payments being highly complemented with debit card payments. However, banking apps are gaining traction and are likely to continue growing as a payment method, the report states.
Other payment methods, such as digital payments (for example, virtual cards), “remain niche and exclusive”.
“The correlation between affluence and level of education against the different payment method applications is clear,” the study states.
How consumers are spending their money
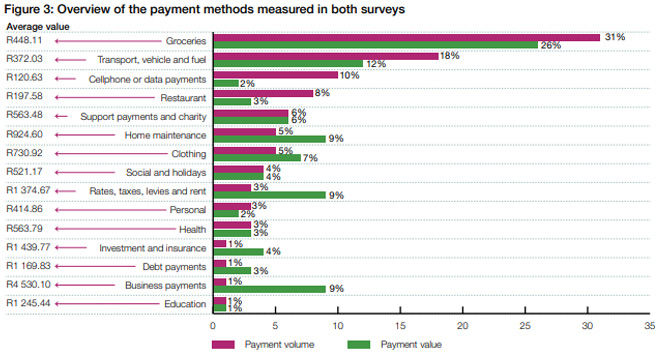
In the DCPC survey, 38 payment classifications were measured and netted into 15 overall categories.
The average value of payments varies significantly across categories. When it comes to individual payments, business payments (likely from sole proprietors) are the highest. They are followed by debt payments, investment and insurance, rates, taxes, levies and rent, and education, respectively.

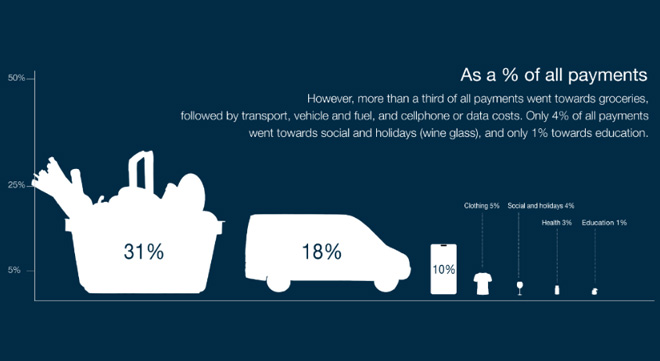
By number of transactions, the top three payment groups are groceries (31%), transport (18%), and data (10%).

The table also measures the volume of payments versus the value of payments in the categories.
The volume of payments refers to the number of transactions made within a given period, regardless of their monetary value. It indicates how frequently payments are being made, such as how many times consumers use debit cards, mobile payments, or other methods.
The value of payments, on the other hand, represents the total monetary amount of all payments combined within the same period. This measures how much money is being transferred in these transactions.
Unsurprisingly, most consumer payments (48%) are made at the end of the month, and 27% are made at the beginning of the month, and 25% in the middle of the month.
The busiest payment days are Fridays (19%) and Saturdays (19%); the slowest are Tuesdays (8%).
Cash – and debit cards – are king
Cash payments account for 56% of transactions by volume but only 21% by value, reflecting their low average transaction amount.
ATMs, used by 55% of people, are the primary method for accessing cash, followed by cash-back at point of sale (POS) at 28%.
Cash-back at POS has enhanced accessibility, particularly for those without nearby ATMs. Lower-income individuals use cash-back at POS more frequently, and women often withdraw cash while shopping.
Higher-income groups use cash less frequently, indicating the risks and limitations associated with cash usage.

Switching over to card payments, debit card payments account for 34% of transactions by volume but 55% by value.
Debit cards (including savings, cheque, or debit cards) dominate, with 93% usage, compared to SASSA cards at 6% and retail debit cards at 0.2%.
(Note: Of the 18 million SASSA cards in South Africa, 6.8 million were used in this survey.)
The study shows that although debit cards are frequently used for grocery purchases, they contribute less to the overall transaction value because of lower average transaction amounts.
In terms of unstructured supplementary service data (USSD), 22% of debit card consumers access their account using the USSD facility. This may include purchasing airtime, electricity, and other functions as may be available on the USSD platform. Both short message service (SMS) and USSD options are used more frequently than internet banking.
Last, 12% accessed their account by phoning the bank.
(Note: percentages exceed 100% because of multiple access methods.)
“The interplay between cash payments and debit cards may be for practical reasons (i.e. to not carry a large amount of cash). The debit card is likely to continue to gain share over cash as a result of factors such as rising food prices, which lead to higher payment values per purchase,” the report states.
Trailing behind…
Bringing up the rear are credit card payments, internet banking and banking app payments, and sending money.
Credit card payments account for 1.9% of transactions by volume and 4.3% by value. Ownership is predominantly among the affluent, with cards often used to assist others as a loan-like facility.
The latter may explain why there is a gap between reported usage in the two surveys. The consumer diaries show that credit card usage is much more frequent, relative to the consumer payment choice survey. This seems to be explained by people using a family member’s credit card.
According to the report, the primary reason for applying is access to credit (37%), followed by rewards and loyalty points (25%), and online/retail payments (11%).
Despite the credit facility of a credit card, on average, credit card holders have insufficient funds 3.4 times a year compared to the 1.96 times a year, on average, for debit card consumers. The 58% of credit card holders who have experienced insufficient funds are also higher than that of debit card holders.
Internet banking payments account for 1.6% of transaction volume and 6.7% of value, while banking app payments represent 5% of volume and 12% of value.
Interestingly, although internet banking has been available longer, only 27% of South Africans use it, compared to 50.3% using banking apps. However, banking apps account for a larger share of payment value (11.5% or R12.9m).
Sending money payments account for 0.5% of transactions by volume and 1% by value.
According to the report, most agreed that the services are convenient, easy to set up, widely accepted, and secure. However, hidden fees are a noted barrier. Overall satisfaction with this payment method is high at 90%, with ease of use (24%), convenience (15%), and speed (14%) being the top reasons for its popularity.
In the “other payment methods” category, the report consolidates digital payments, loyalty cards, and cardless payment methods. The three payment methods combined have a volume share of 0.9% and value share of 1.1%.
“These are complex payment methods with a very small consumer base. From a volume perspective, the youth, more educated and more affluent groups tend to dominate usage across the three payment methods,” the report stated.
The outlier – crypto assets
Crypto assets are the final payment method measured by the report.
According to the report, crypto-asset investors represent 2.3% of the population, while only 7% (2 918 501) of the South African population know about crypto assets.
Bitcoin (BTC) and Bitcoin Cash (BCH) are observed to be the top two crypto assets, with BTC by far being the best known. Of the 2% who do invest in crypto assets, 57% invested in BTC.
The report found that most consider the purchase of a crypto asset as an investment.
“However, a range of reasons are given, including those who are anti-establishment and do not trust the banks, favour the fact that there are no laws governing crypto assets or do not trust the government,” the report states.
Few (21% of 2% of the population) mentioned that they use it to buy goods and services.
Investment behaviour
The report also analysed investment behaviour. According to the findings, in South Africa, many cash investments occur through informal savings mechanisms such as stokvels and burial societies.
(Note: Stokvels were viewed collectively, without distinguishing between types – for example, grocery, holiday, or birthday stokvels – while burial societies may include formal funeral cover policies.)
The report’s findings note:
- Less than half (46%) of South Africans invested in the past year, with 14% making additional contributions, mostly in cash to burial societies or stokvels.
- Older individuals invested more than younger ones.
- The top three investment vehicles by awareness are burial societies (65%), stokvels (54%), and bank savings options (51%), such as 32-day notice accounts.
- Fintech (5%) and meditech (4%) investments had low awareness.
- In terms of actual investments, burial societies (35%), stokvels (20%), and bank savings (18%) held a collective 73% market share.
The four most common payment methods for investments are cash (54%), debit cards (54%), banking apps (21%), and internet banking (11%).
Debt and debt management
The report found that a large percentage of borrowed money is not recorded in the formal sector.
According to the report, most people borrow money from friends or family (28%). This is followed by other informal borrowing agents such as loan sharks or mashonisa agencies (10%), stokvel groups (10%), colleagues (9%), or the retail store (borrowing or buying on credit) (9%). Formal avenues such as banks (6%) are considered only after these options are utilised.
According to the SCPC, more than half the population (52%) owe someone money; about half of this group (28%) did not know or refused to disclose the amount. Thirty-eight percent considered that the current amount owed is about the same as last year, while 40% stated it is less or much less.
“This is most likely the aftermath of recovering strategies from the Covid-19 pandemic,” the report states.
When it comes to debt, the report found that:
- On average, the amount owed per person is relatively low at R5 435.
- White consumers owed the most at R33 381.
- The farming community has a higher average debt value than the other area classifications.
- Only 3% of the country are under debt management.
- The average interest rate charged on borrowed money is 9.1%.
- The interest rate for white consumers, those who owe more to banks than other race groups, is slightly higher at 11.1%.
Read the full study here.


