
One valuable lesson that I learnt over many decades is that the only element under my control in managing investments is the weighted average payback period to recover the current value of my total investment portfolio through income streams and payback of principal (technically known as duration).
“Duration (payback period) is an extremely useful statistic but is largely ignored by investors and even financial planners. That’s probably because it isn’t a simple calculation, and it’s not always interpreted correctly.” (John P. Hussman, 23 February 2004)
Payback period is also an indicator of risk. The longer I must wait for the initial capital invested in an asset to be repaid, the more vulnerable the market value of the asset is to a myriad of adverse factors beyond my control.
Duration is mostly calculated for bonds and other financial assets that consist of fixed cash flows. The duration of the US Aggregate Bond Index and SA All Bond Indices is currently about six years.
Payback periods for other assets, specifically equities, are also quantifiable and essential in calculating my risk budget based on the weighted average payback period.
The general view among investors is that the payback period for equities is “VERY LONG”.
Some use the price-to-dividend ratio as a proxy for the payback period, while others prefer the price-to-earnings ratio, as retained income is reinvested in the company on the investor’s behalf. Big market-moving economic events such as geopolitical, global economic, and country-specific issues cause significant volatility in PE ratios because of temporary write-offs and write-backs. The trailing 12-month S&P 500 PE ratio is currently 29.8 times, and the price-to-dividend ratio is 81.3.
Yale University Professor Robert Shiller’s Cyclically Adjusted PE Ratio (PE 10) is based on average inflation-adjusted earnings from the previous 10 years and looks through short-term impacts on earnings such as big market-moving economic events and cycles. The inflation-adjusted S&P 500 PE is calculated by the real or inflation-adjusted price divided by the average inflation-adjusted earnings from the previous 10 years and currently stands at 29.9.
The payback period based on historical earnings is therefore about 30 years.
If the investment decisions were based on the average S&P 500 PE 10 ratio of 16.5 since 1881, investors would have been shy of equities since 2008 because of excessive PE10 ratios and missed a major bull market.
Although the Shiller PE 10 ratio is certainly a better metric than the ordinary PE ratio based on 12-month trailing earnings, it has a major shortcoming in that it is backward looking, while the market in general tends to look at future earnings growth. The PE 10 ratio is therefore too conservative and leads to too high valuations deeming the equity markets overvalued.
To overcome the said drawback, I calculate the forward PE 10 ratio by dividing the real price by the average inflation-adjusted earnings 10 years hence.
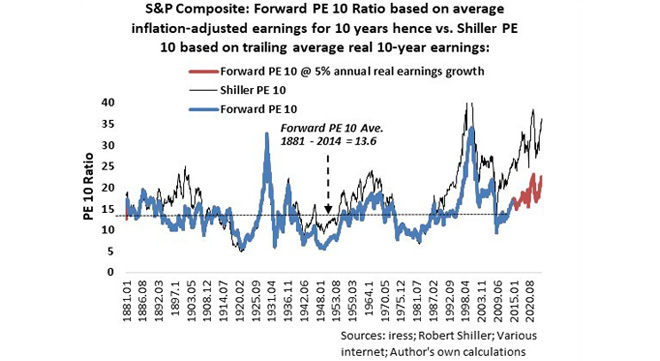
From the accompanying graph, it is evident that from 1881 to 2014, the forward PE 10 of the S&P 500 index ranged in a band of between 5 and 20 and overshot 20 on the upside from 1928 to 1930 and from 1998 to 2000. Yes, before the advent of the two famous stock market crashes.
To estimate the forward PE 10 from 2014 onwards depends on the assumed growth for real earnings per share over the next 10 years. Real earnings per share over the past 50 years grew by 2.6% a year, 3.45% over the past 25 years, 3.6% over the past 10 years, and 3.7% over the past five years. Considering the quickening pace in real earnings growth, I deemed it reasonable to assume that real earnings growth could average 4% a year over the next 10 years.
It means that the forward PE 10 ratio is currently 22.6, topping the upper-end of the 1881-2014 range and entering the dangerous blow-off stage. Yes, the S&P 500 index is priced for perfection and is very vulnerable. This is not to say that the market will collapse, as the forward PE 10 may remain elevated as it did in the 1960s and from 2005 to 2008.
For illustrative purposes, I calculated the weighted payback period of a traditional balanced portfolio consisting of 60% equities, 30% bonds, and 10% Treasury bills using the S&P 500 Index, US Aggregate Bond Index, and US Treasury Bills, rebalanced annually.
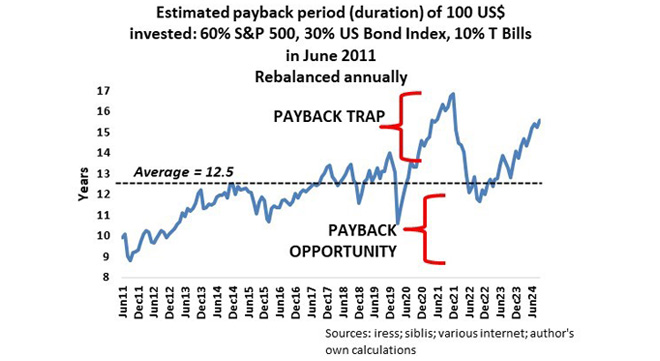
From the accompanying graph, it is evident that the estimated payback (duration) of the balanced portfolio is about 15.6 years, or three years above the average since June 2011, and approaching the high of 16.9 years in November 2021. It is evident that this portfolio is in a payback trap – yes, the risks are high. Drastic action will be needed to lower the payback period if I held this portfolio, otherwise what happened in 2022 will be repeated. Actions could include lowering total equity exposure, diversifying equity exposure to include other equity markets, and sector rotation from very long payback stocks to much shorter payback stocks.
Although I am still an equity bull, I am shortening the payback period of my total investment portfolio in line with my risk budget.
Ryk de Klerk is an independent investment analyst.
Disclaimer: The views expressed in this article are those of the writer and are not necessarily shared by Moonstone Information Refinery or its sister companies. The information in this article does not constitute investment or financial planning advice that is appropriate for every individual’s needs and circumstances.


Splendid article Ryk!