South Africa’s five largest life insurers have seen recent death claims against fully underwritten life policies starting to return to pre-pandemic levels.
The Death Claims Dashboard, maintained by the Continuous Statistical Investigation (CSI) Committee of the Actuarial Society of South Africa (ASSA), shows that 617 death claims were received in August 2022 – the lowest since April 2020, when 540 death claims were submitted.
According to Anja Kuys, the chairperson of ASSA’s CSI Committee, the usual number of claims expected for fully underwritten new-generation life policies would be between 600 and 700 a month in pre-pandemic years.
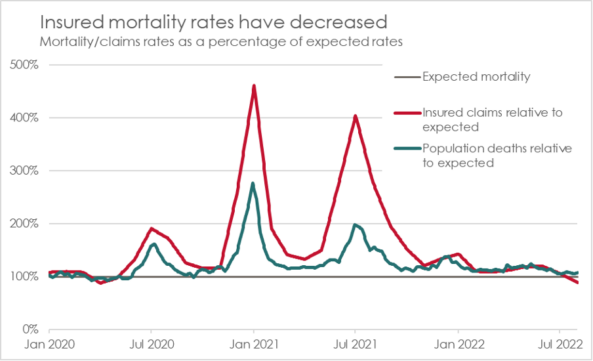
The number of monthly death claims received by the five life insurers started increasing rapidly from June 2020, peaking above 2 700 a month twice: in January 2021 and again in July 2021.
The dashboard indicates that of the 31 520 death claims received by the five insurers between March 2020 and August 2022, some 4 706 claims (15%) were due to confirmed Covid deaths.
Kuys said death claims for policyholders who died due to Covid started dropping to single-digit numbers from March this year, reaching zero for the first time in August.
She pointed out, however, that the actual number of Covid-19 deaths was much higher. She said claim forms generally do not specify Covid-19 as the cause of death and only state whether the cause was due to natural or unnatural causes.
“What is clear, however, is that Covid-19 is no longer claiming as many lives as it did in 2020 and 2021,” Kuys said.
Insured population excess deaths
During the first two years of the pandemic, death claims against fully underwritten life policies exceeded the expected number by a significant margin. However, since February this year, the additional death claims over and above the expected number started stabilising between 10% and 20%, Kuys said.
Although statistics from the South African Medical Research Council (SAMRC) show that the actual death rate for the overall South African population (teal line in the graph below) also exceeded the expected rate during the pandemic, Kuys said more significant divergences were seen for insured lives (represented by the red line in the graph below).
“Differences in insured mortality compared to overall population mortality were present in South Africa even pre-Covid because the average age of the insured population is higher than that of the overall South African population. The SAMRC statistics also include children, a population group that did not experience excess deaths during the pandemic. We were, however, surprised that the mortality rate for insured lives exceeded the expected death rate by such a large margin during the first three Covid-19 waves.”
Kuys said this highlights why it is important for life insurers to have access to credible statistics relating to the insured population, enabling them to make provisions for sufficient capital reserves and pricing.
Equally surprising, according to Kuys, was the subsequent levelling of the mortality rate of insured lives (highlighted in the graph below). She cautions, however, that the most recent months may be missing deaths that have not yet been reported.
“While we do not have definitive answers as to why the mortality rate of the insured population relative to before the pandemic has settled in line with that of the general population, we do believe that there was a higher take-up of vaccinations among policyholders than the rest of the population.”

Where the dashboard gets its data
Kuys said the Death Claims Dashboard was designed to track excess death claims against fully underwritten new-generation individual life policies due to Covid to help life insurers provide for adequate capital reserves and guide accurate pricing of future policy benefits.
Claims statistics for the dashboard are submitted by five of the country’s biggest life insurers, representing about 85% of South African individual life insurance premiums. These insurers have between them about 2.09 million fully underwritten life policies on their books.
Kuys said with Covid-19 no longer classified as a pandemic and with the death claims rate stabilising, there is value in maintaining the dashboard to identify other emerging trends. She said the dashboard does, for example, differentiate between claims submitted for natural and unnatural deaths.
Unnatural deaths
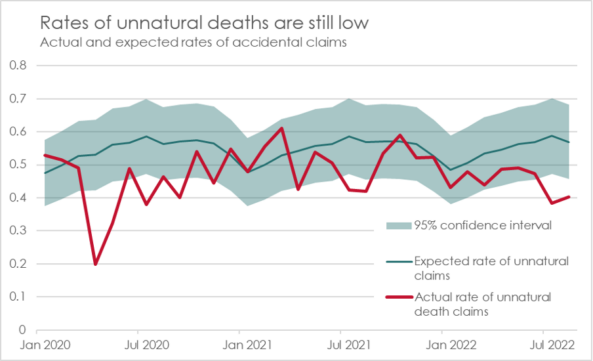
Interesting in the graph below is the steep drop in unnatural deaths during the hard lockdown, as well as the correlation between public holidays and school holidays and an increase in unnatural deaths, probably as a result of traffic accidents and alcohol-related violence. Accidental deaths are, however, still trending on the lower end of the pre-pandemic expected range.
“While this may be as a result of deaths that have not yet been reported, it could also be due to more people working from home,” Kuys said.
She added that policyholders with fully underwritten life policies tend to fall into the higher-income groups with occupations that allow for remote work.

Death claims by gender
The dashboard also shows that the death claims rate for men and women increased by the same percentage in line with the expectation that the death claims rate for male policyholders will be almost double that of female policyholders.

Death claims by age band
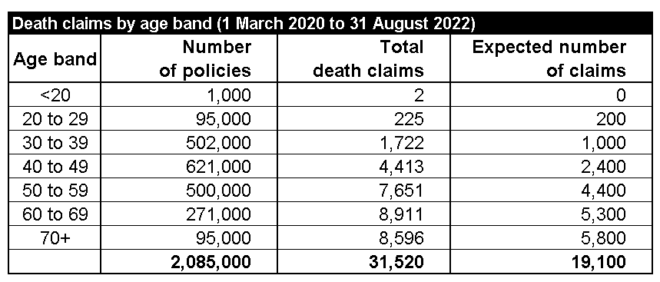
According to Kuys, the impact of Covid-19 has been surprisingly similar across all age groups in that the number of claims has almost doubled for younger lives, as well as for the older ages.


