While “sound”, the South African medical schemes industry has taken something of a hammering, with an overall 79% drop in net results in 2022, the latest Alexforbes Medical Aid Insights publication finds.
The publication provides a detailed overview of the performance of the medical schemes industry. It examines key statistics and trends from 2000 to 2022 based on financial data from all registered medical schemes in the annual Council for Medical Schemes (CMS) report. The Medical Aid Insights also reviews the 10 largest and restricted schemes by principal membership.
In 2022, the industry had a net income of R2.57 billion, including investment and other income, compared to R12.18bn in 2021. The operating deficit in 2022 was R6.155bn, marking the largest deficit in 23 years.
Net income is the profit that remains after all expenses and costs, such as taxes, have been subtracted from revenue.
A scheme’s operating surplus is an indication of its financial soundness after claims and non-healthcare expenditure (NHE) are deducted from the contribution income.
Schemes that incur operating deficits must rely on investment income to subsidise claims and NHE, to achieve a net breakeven result.
Read: Most schemes rely on investments to achieve a net breakeven result – report
South Africa’s two medical scheme giants
Discovery Health Medical Scheme (DHMS), an open medical scheme, and the Government Employees Medical Scheme (GEMS), a restricted scheme, continued to lead the industry in beneficiary numbers and growth.
The publication highlights that it was their combined membership growth (22 532 principal members for DHMS and 32 031 for GEMS) in the 2022 financial year that finally pushed the total number of beneficiaries covered by medical schemes to more than nine million for the first time.
As of 31 December 2022, DHMS had 2 810 992 beneficiaries, while GEMS had more than 2.1 million beneficiaries.
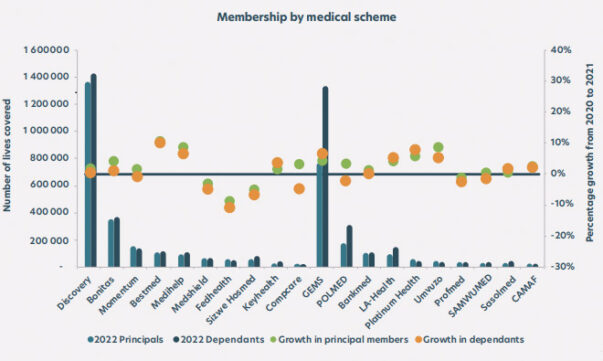
According to stats shared in the Medical Aid Insights, DHMS had slightly more than 1.3 million principal members in 2022, while GEMS had about 800 000.
Notably, DHMS’s dependants, totalling just over 1.4 million, slightly exceeded its principal membership, whereas GEMS’s dependants, about 1.3 million, significantly outnumbered its principal members.
Among open medical schemes, Bonitas had the second-largest number of principal members (just under 400 000) in 2022.
Polmed clocked in as the second largest restricted medical scheme, with about 300 000 principal members.
From a long-term perspective, Discovery’s market share, based on the number of principal members, grew from 15.9% in 2001 to 33.5% by the end of 2022. In contrast, the market share of other open schemes declined from 53.6% in 2001 to 24.5% in 2022.
In 2022, GEMS’s total market share was 19.6% compared with 1.7% in 2006 when the first members joined. GEMS was registered on 1 January 2005, specifically to meet the healthcare needs of government employees.
The total market share of the balance of restricted schemes decreased from 30.5% to 22.4% since 2001.
Size and scale
According to Alexforbes Healthcare, key factors for evaluating medical schemes include size, membership growth, financial performance, and solvency. When it comes to size, larger schemes “tend to have a more stable and more predictable claims experience”.
In 2000, South Africa had 144 registered medical schemes. By 2022, this number had decreased to 71 (16 open and 55 restricted schemes), down by two from 2021 because of a merger between Nedgroup Medical Aid Scheme and Bonitas Medical Fund, as well as the liquidation of Health Squared Medical Scheme.
Despite the reduction in schemes, the industry grew by 1.6 million principal members (62%) and 2.4 million beneficiaries (37%) since 2000. By the end of 2022, medical schemes covered 4.11 million principal members and 9.04 million beneficiaries.
In 2022, the number of principal members increased by 1.2%, while the total beneficiaries rose by 1.1%, “mainly driven by a growth in beneficiaries covered on restricted medical schemes”.
GEMS was the major driver, with an increase of 107 146 beneficiaries over the year.
Of the principal members, 58% were in open schemes and 42% were in restricted schemes.
Membership growth
Alexforbes Healthcare explains that a large membership base reduces claims volatility and helps schemes or administrators to negotiate better rates and fees with healthcare service providers.
“This ensures that medical scheme members have lower shortfalls or co-payments when using these designated service providers.”
The top 10 open schemes and top 10 restricted schemes focused on in the Medical Aid Insights represent 91.6% of all principal members participating on a registered medical scheme, or 98.4% and 82.2% of open and restricted medical scheme membership, respectively.
The top 10 open schemes in 2022, in order, were:
- Discovery
- Bonitas
- Momentum
- Bestmed
- Medihelp
- Medishield
- Fedhealth
- Sizwe Hosmed
- Keyhealth
- CompCare
The top 10 restricted medical schemes, in order, in 2022 were:
- GEMS
- Polmed
- Bankmed
- LA-Health
- Platinum Health
- Umvuzo
- Profmed
- Samwumed
- Sasolmed
- CAMAF
Seven of the open schemes and nine of the restricted schemes experienced positive growth in 2022, with the rest experiencing a reduction in membership.
For open medical schemes, Bestmed experienced the largest increase in principal membership (10.6%).
Fedhealth experienced the largest decrease in principal membership (8.6%).
CompCare experienced an increase of 3.1% in principal membership and a decrease in dependants of 4.8%. The net result of this was a growth of 0.1% in total beneficiaries on this scheme.
For restricted medical schemes, Umvuzo experienced the largest increase in principal membership of 8.8%.
Profmed was the only restricted scheme that experienced a decline in principal membership with a decrease of 1.3%.
Membership profile
One of the most important contributing factors to a scheme’s performance is the risk profile of its members, with some of the key statistics being the average age of beneficiaries, pensioner ratio (defined as the percentage of beneficiaries over the age of 65 years), and average family size.
As Alexforbes Health explains, claims experience will be more favourable for younger populations with lower chronic prevalence.
“As a scheme gets older, we expect the average claims per member to increase, with a benchmark average claim increase of 2% for every year of ageing experienced.”
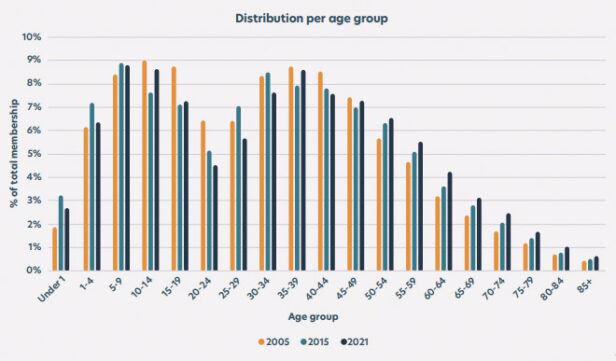
Note: The graph shows the change in membership per age group for 2005, 2015 and 2021. The distribution of membership by age group for 2022 was not made available in the annexures to the 2022/23 CMS Annual Report.
In South Africa, the average age of beneficiaries has increased consistently from 2012 to 2022. This is with an exception in growth in the age group 35 to 39 years, “which is predominately driven by females seeking medical protection during childbearing age”.
Alexforbes Healthcare says the decline in young working individuals enrolling in medical schemes is a concern.
“As claims increase by age, and with the possible anti-selection of females during childbearing age, schemes need to take steps to ensure that medical scheme coverage remains affordable and accessible to younger members.”
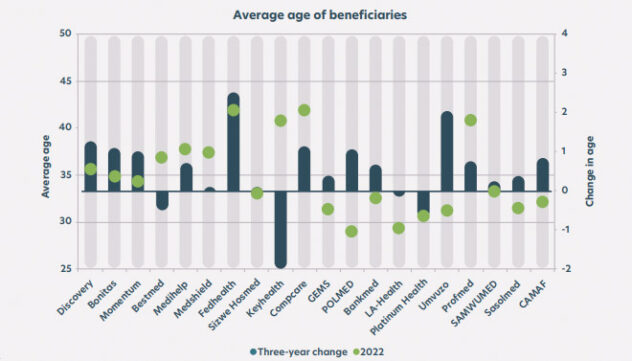
Of the 20 schemes included in this year’s Medical Aid Insights, CompCare and Profmed have the highest average age of beneficiaries in the open and restricted medical scheme industries, respectively.
Over the past three years, Fedhealth has aged the most (2.5 years) and KeyHealth has experienced the largest decrease in average age (2.2 years). As in previous years, Polmed has the lowest average age out of all the schemes considered.
The average pensioner ratio across the industry increased from 9.1% to 9.3% in 2022 while the average family size remained the same from 2021 to 2022 at 2.2.
Financial results
One of the key factors used to measure the performance of a medical scheme is the scheme’s operating result. It shows the surplus or deficit before investment income.
Alexforbes Health states that the operating deficit of R6.155bn experienced by the industry in 2022 was largely because of an increase in claims to pre-Covid 19 levels.
Claims are expected to keep rising as members utilise more health services following limited access to screening facilities and elective procedures due to the lockdowns in 2020 and 2021.
Of the 20 schemes considered in this year’s Medical Aid Insights, only four restricted schemes attained an operating surplus in 2022. The rest of the remaining schemes made operating deficits.
Open schemes incurred an operating deficit of R5.33bn, driven by the large operating deficit of R3.28bn generated by Discovery.
Restricted schemes incurred an operating deficit of R821 million, driven by the operating deficit of R798m generated by GEMS.
To turn this frown upside down, schemes that incur operating deficits usually rely on investment income to achieve a net break-even result.
However, while profit was still made, the industry saw a significant drop in net result in 2022 – from R12.18bn achieved in 2021 to R2.57bn in 2022.
Open schemes achieved an overall net deficit of R1.79bn (2021: R4.06bn surplus), while restricted schemes achieved an overall net surplus of R4.37bn (2021: R8.12bn).
Of the 71 schemes, 42 made a net surplus in 2022 versus 64 out of the then-existing 73 schemes in 2021.
The breakdown for 2022 was seven of 16 open schemes and 35 of 55 restricted schemes, compared with 11 of 17 open schemes and 53 of 57 restricted schemes achieving a net surplus in 2021.
The 57 restricted schemes referred to for 2021 include Quantum Medical Aid Society, which amalgamated with Discovery Health Medical Scheme on 1 August 2021.
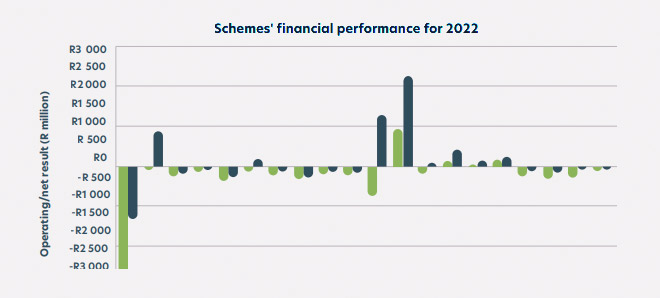
The publication does not state whether the significant drop in net results for medical schemes in 2022 was because of the high operational deficit or a general decline in investment and other income.
Solvency levels
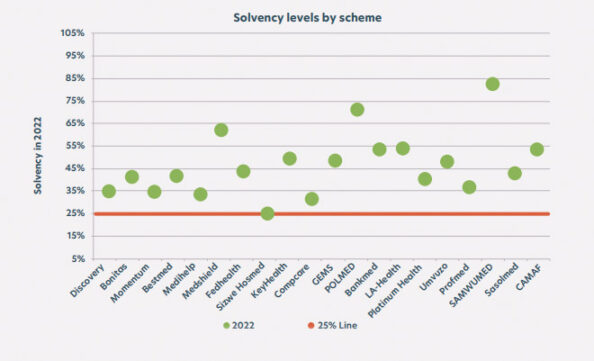
The solvency ratio is the level of reserves (accumulated funds) that a medical scheme needs to hold as a percentage of gross annualised contributions. Regulation 29 promulgated in terms of the Medical Schemes Act prescribes that medical schemes maintain a minimum solvency ratio of 25%.
In 2022, the average solvency for all schemes increased to 47.2% from 46.7% in 2021.
The solvency level for open schemes decreased from 39.6% in 2021 to 38.0% in 2022.
The solvency level for restricted schemes increased from 56.2% in 2021 to 59.5% in 2022.
The graph below illustrates the solvency levels for the 20 schemes considered at the end of 2022.
