Doomsayers argue that the current recessionary conditions worldwide are likely to worsen in the coming quarters, mostly because interest rates will stay higher for longer, as central bankers will remain hawkish in their battle to force “sticky” inflation (inflation excluding energy and food) down to manageable levels.
Financial markets, on the other hand, are telling us that the landing or bottom will be soft or less severe, as central bankers are likely to become dovish and will rein in their quantitative tightening, therefore cutting rates from as early as the first quarter of 2024.
But where to from now?
In theory, a full economic cycle consists of two distinct sub-cycles: expansion and recessionary conditions. The expansion cycle is normally characterised by an economic recovery after a recession, followed by overheating, while recessionary conditions are when economic growth stalls and could contract, sometimes leading to a recession.
In practice, each full economic cycle may differ significantly from the others because it may consist of multiple sub-cycles – in other words, growth may stall, but accelerated growth will follow.
From an investment strategy point of view, it is crucial to ascertain not only where in which economic cycle you are but, most importantly, what cycle lies ahead. Between the current and ensuing cycle is what I term a transitional phase. It is specifically relevant because major financial market players do their asset allocations in anticipation of the next cycle.
What the Inventories to Sales Ratio tells us
In my opinion, the key indicator of where we are in the global economic cycle is unquestionably the Federal Reserve’s Total Business: Inventories to Sales Ratio (ISR), which is effectively an efficiency ratio to ascertain the rate at which the US economy is liquidating its inventory, calculated by the amount of inventory in the economy divided by the total sales amount.
The ISR typically rises sharply when the US economy falls into a recession, because businesses struggle to cut back production as quickly as sales decline. Inventories last longer and force businesses to incur extra finance, storage, and maintenance costs and leverage their balance sheets, causing lenders to increase their lending standards.
When the economy recovers and sales begin to rise, the ISR falls, and businesses need to step up production to align inventory levels more closely with sales.
Historically, transitional phases in US economic cycles occurred at major turning points in the ISR.
When the ISR bottomed, the US ISM manufacturing PMI peaked and started to decelerate as manufacturing production growth eased. US banks began to be less accommodative in lending to corporates, while industrial commodity prices (Economist Metals Index in US dollars as proxy) peaked on weaker demand.
Conversely, when the ISR peaked, the US ISM manufacturing PMI bottomed and started to rise. US banks began to be more accommodative in lending to corporates, while industrial commodity prices bottomed on stronger demand.
Initial stages of accelerated growth
Anecdotal evidence suggests that at the end of the third quarter this year, the global economy entered a new transitional phase, from recessionary conditions to the initial stages of accelerated growth.
It is particularly evident in the US, where the ISR of total business in the US has peaked in the second quarter of this year and dropped by 2.9% since June, while the ISR of the wholesale sector fell by 5.6%. The latest PMI data from S&P Global indicates that the reduction in inventories in the manufacturing sector of the US economy continued, while input buying stagnated.
US and euro area banks have turned less restrictive in their lending practices because the demand for business and consumer loans is contracting.
The latest data from China indicates that economic stimulus announcements targeting infrastructure and manufacturing projects, and boosting consumption and employment, are already having an impact on China’s economy. Manufacturing output has returned to expansion, business optimism rebounded, and domestic supply and demand have increased. Solid Chinese demand saw iron ore prices jumping by 30% since August, while the Baltic Dry Index, a benchmark for the price of moving bulk raw materials by sea, surged by more than 127% since the end of October this year.
Which asset classes are likely to perform well?
My risk strategy regarding major asset classes is based on what happened historically during a new transitional phase from recessionary conditions to the initial stages of accelerated growth. During this transitional phase, the best-performing asset classes and sectors during the recessionary cycle are unlikely to repeat their superior performance.
Global government bonds, specifically developed market bonds, are likely to provide the highest return per unit of risk among all asset classes. Global government bond yields over the entire duration spectrum have already begun shifting downwards, while shorter-dated bonds yields are falling more than longer-dated bonds (steepening yield curves), and the trend is likely to continue.
This new transitional stage favours a risk-on strategy because the new bull market in industrial commodities that started in the third quarter will grow stronger. A major re-rating of industrial commodity (materials) stocks and emerging market assets, including emerging market currencies, specifically those of commodity-dependent economies, through to the end of 2024 is on the cards.
Emerging markets’ sovereign debt is expected to outperform developed market debt because higher yields and the improved outlook for emerging market currencies justify an overweight exposure. But sovereign risk management is crucial because continued heightened geopolitical risk, allegiances, and national elections during 2024 may have a major impact in the perceived risk of investing in a particular country or region.
Sticky inflation (CPI inflation excluding food and energy) tends to lag the industrial commodity cycle by four to five quarters. The Economist Metals Index in US dollars (a proxy for industrial metal prices) made a cycle low in the second quarter and therefore points to a cycle low in “sticky” inflation by the end of the second or third quarter next year, supporting US treasuries’ pricing in four cuts in the Federal Funds Rate next year.
Declining interest rates will unequivocally lend tremendous support to interest rate-sensitive and economically cyclical stocks. Therefore, financial, real estate, and industrial stocks are likely to outperform the broad market indices, while consumer discretionary, communication services, and information technology stocks could perform market neutral. Consumer staples and utility stocks could turn out to be the laggards.

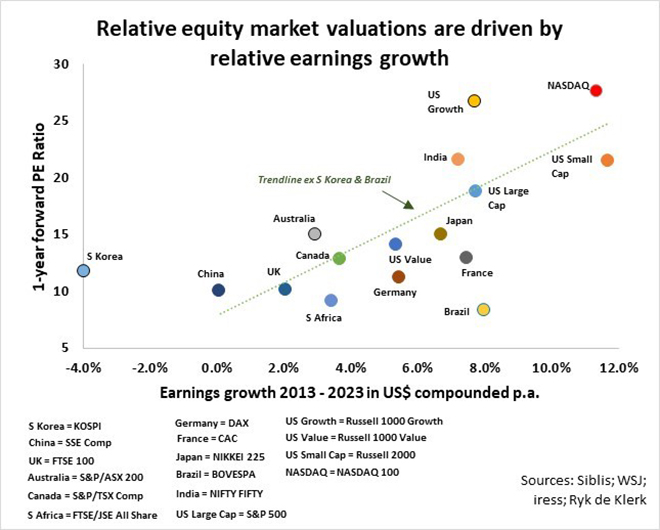
Based on earnings growth over the past 10 years in US dollar terms and current forward price-to-earnings ratios, I favour large-cap indices in Germany, France, Japan, and South Africa, as well as US Value shares ahead of tech-laden US growth stocks, the broad Nasdaq and India indexes.
Yes, I am increasing my risk budget to my maximum acceptable level.
Ryk de Klerk is an independent investment analyst.
Disclaimer: The views expressed in this article are those of the writer and are not necessarily shared by Moonstone Information Refinery or its sister companies. The information in this article does not constitute investment or financial planning advice that is appropriate for every individual’s needs and circumstances.


