South African financial markets (stocks and bonds) are reeling because global investors and local business leaders have lost confidence in the country. To quote Bloomberg, “Economic stagnation spawned by record daily power outages, rampant crime, disintegrating infrastructure, and foreign policy missteps is leading investors to the exits.”
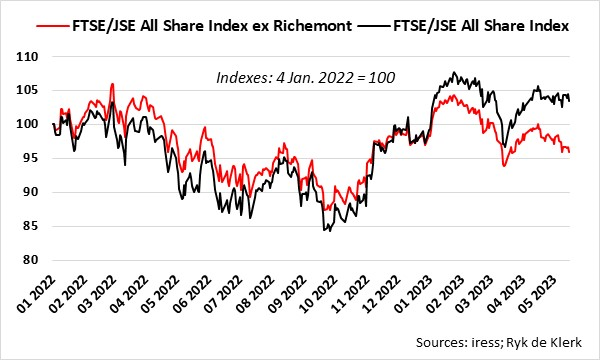
Since the end of 2022, the FTSE/JSE All Share Index (Alsi) has underperformed the emerging market universe. The Alsi fell by 6.5% in US dollar terms, whereas the MSCI Emerging Markets Index rose by 2.3%. The Alsi excluding Richemont fell by more than 13%.
But everything has a price. It is therefore essential to determine how South African financial markets are priced relative to financial markets in other emerging economies.
I excluded Richemont when I calculated the valuation metrics of the equity market in South Africa and compared them to the rest of the world. Richemont is a First World, non-South African company with high valuation metrics.

The 120% surge in Richemont’s share price on the JSE from its lows in May last year masks the actual performance of the rest of the Alsi. Over the same period, Richemont’s market capitalisation (issued shares times share price) effectively doubled to nearly 22% of the total market capitalisation of the Alsi. At Friday’s close, the Alsi was 3.5% higher than it was at the beginning of January last year. However, stripping out Richemont, the index fell by more than 4%.
Over the same period, the Alsi fell by 14.3% in US dollar terms compared to falls of 12.6% and 20% in developed markets (MSCI World Index) and emerging markets (MSCI Emerging Markets Index), respectively. The Alsi excluding Richemont fell by 20%, in line with emerging markets.
The underperformance of the South African stock market since the end of last year should therefore be seen in context, though the market excluding Richemont effectively gave back the relative outperformance against emerging markets in 2022.
Richemont also dominates the FTSE/JSE Consumer Products and Services sector, with a weight of more than 99% of the sector’s total market capitalisation.
Richemont’s surge led to an ambitious or lofty valuation. Richemont’s Shiller PE10 or CAPE ratio is more than 53 times. Yes, it is higher than Apple’s 46 times, according to gurufocus.com.
There are many stock valuation metrics, and each has its pros and cons. I tend to prefer the Cyclically Adjusted PE Ratio (CAPE Ratio or PE10), derived by Robert Shiller, Nobel Prize laureate in economics, based on average inflation-adjusted earnings from the previous 10 years and smoothing out the cyclical effects of the economy.
High CAPE ratios normally indicate that more people are willing to pay for a share, sector, or market because of attractive growth prospects. Conversely, low ratios normally indicate that more people are willing to pay less because of weak growth prospects and higher risk.
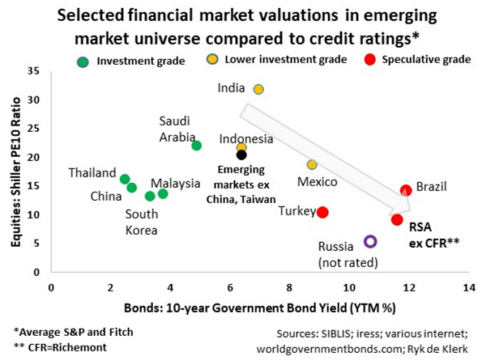
Regarding stock markets on a national level, I find it useful to plot stock market valuations against the relevant government bond yields, as well as country credit ratings, as both indicators consider variables such as monetary and fiscal policies, inflation, domestic political risk, geopolitical risk, and growth prospects.

From the accompanying graph where I plotted selected emerging markets, it is evident that there tends to be a direct relationship between credit ratings, stock market valuations and 10-year government bond yields, specifically in the lower investment and speculative grade grouping. Weaker credit ratings lead to higher bond yields, resulting in lower stock market ratings.
Financial markets (stocks and bonds) in South Africa appear to be priced in line with their peers in the speculative grade group. The South African stock market appears to be about a third cheaper than Brazil. At this stage, it does seem that a lot of bad news is already priced into South African stock market valuations.
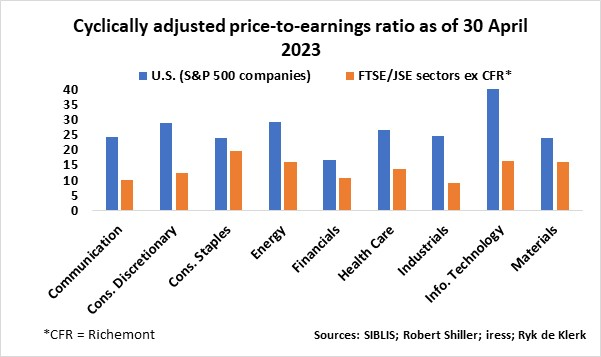
I also calculated the CAPE ratios for the JSE sectors, excluding Richemont, and compared them to SIBLIS Research’s results for the US market using S&P 500 companies as of 30 April 2023. It is evident that the JSE sectors, on average, trade at a discount of just over 50% to the US market. The exception is consumer staples where the discount is just over 20% because of the dual-listed British American Tobacco’s weight in that sector.

It will take many years of good governance, financial discipline, and sustained economic growth before South Africa will again achieve an investment grade credit rating and see its bond and equity markets re-rating to Mexico’s levels and the JSE sectors narrowing the valuation gaps with the US market.
Although it seems that all the current bad news and prospects are fully priced in, the JSE continues to be vulnerable to what Investec Plc chief executive Fani Titi said last week. “We are going nowhere fast; the government is disorganised; totally disorganised.”
Yes, any stupid remark or action could lead to a further downgrade in South Africa’s credit rating and higher 10-year government bond yields, and therefore lower stock market ratings. Sanctions, civil disobedience, and global stock market sell-offs could also sink South African financial markets.
South Africa is cheap, but is it darkest before dawn?
Ryk de Klerk is an independent investment analyst.
Disclaimer: The views expressed in this article are those of the writer and are not necessarily shared by Moonstone Information Refinery or its sister companies. The information in this article does not constitute investment or financial planning advice that is appropriate to every individual’s needs and circumstances.


