
United States President Donald Trump’s sweeping tariffs since his inauguration on 20 January have had a major impact on financial markets, with investors dumping higher-valuation stocks, specifically US mega-cap technology stocks, and seeking cover against a weakening US dollar, which fell by about 5% against a basket of currencies.
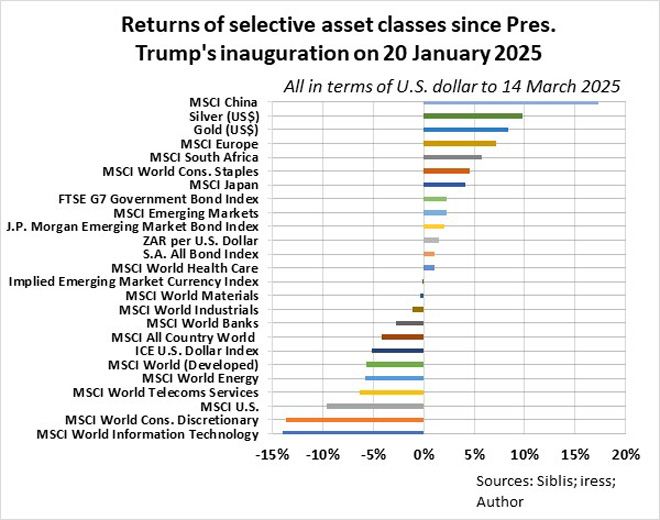
The MSCI World Information Technology Index and the MSCI World Consumer Discretionary Index are down by about 14% in US dollars since Trump’s inauguration, while the broad US stock market (S&P 500) lost 10%. US dollar hedges such as gold and silver gained 8% and 10% respectively, and rotations into ex-US stocks such as Chinese and European stocks saw the MSCI China Index and the MSCI Europe Index gaining 17% and 7% respectively in US dollars.
The weight of US stocks has dragged the MSCI World Index (US$) 5.7% lower since the Republicans came into power. Consumer staples stocks (MSCI World Consumer Staples Index in US$) bucked the trend, returning 5%, while government bonds outperformed stocks broadly, with the FTSE G7 Government Bond Index and the JP Morgan Emerging Market Bond Index returning 2.3% and 2% respectively in US dollars.
US investor confidence is dented.
The CBOE Volatility Index or VIX (higher volatility, reflected by VIX, indicates a greater perceived market risk, and market participants are willing to pay more for insurance against large upswings or downswings) is in anxiety territory, having soared to 28 last week.
The latest New York Fed Business Leader Survey indicates a decline in business activity, while consumer confidence is waning, with higher inflation expectations a particular concern.
After this, where to next?
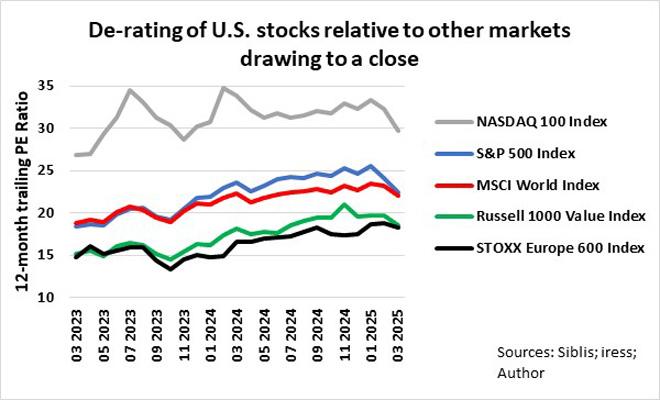
It appears that US stocks, including mega-cap technology stocks, are no longer excessively priced relative to other markets, such as the STOXX Europe 600 and developed markets overall (MSCI World Index in US$). The gap between the 12-month trailing PE ratios of the Russell 1000 Value Index (US value stocks) and the STOXX Europe 600 Index has closed, indicating that the PE ratios of the two series are likely to move in tandem with each other. Ditto with the S&P 500 and the MSCI World Index.
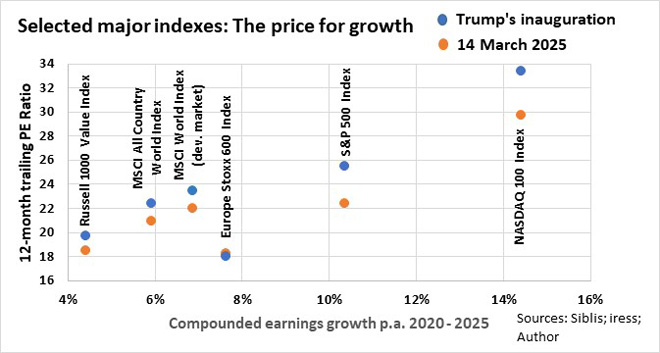
US stock markets are reasonably priced after the sell-off. The NASDAQ 100’s compounded earnings growth over the past five years was 14.4% a year. If the earnings growth trend continues at the same rate over the next five years, the current PEG ratio of the NASDAQ 100 Index is about 2.0 – in line with the average from 2011 to 2020 and a retreat from a high of 2.3 in January, close to the upper range of 2.5 from 2011 to 2020. The PEG ratio of the S&P 500 fell to 2.2 from 2.5 at the time of Trump’s inauguration, while the PEG ratio of the Europe Stoxx 600 increased to 2.4 from 2.36.
The US stock market’s moves since Trump took office are not dissimilar to what happened during the trade war in 2018/19.
In a previous article, “How to navigate anxiety in the approaching US tariffs tug of war”, posted on 13 January 2025, I noted that the average drawdown of the S&P 500 after a major event (trade war escalation) in 2018/19 was about 7%, and the drawdown lasted about 17 business days on average. The drawdown since a high on 20 February to 14 March is 10%, and it has lasted 16 business days thus far.
Have we seen the worst? I simply do not know. It does seem another leg may be lying in wait if the tariff war takes a turn for the worst, as it did in September 2018 when the drawdown exceeded 20% and lasted more than three months. With a 10% drawdown already in the bag, a drawdown of another 10% is probable over the next two months, specifically if the economic fallout is greater than anticipated.
Considering the huge spread between winners and losers among asset classes since the trade war began, I am inclined to rebalance my total investment portfolio by increasing my risk budget.
Ryk de Klerk is an independent investment analyst.
Disclaimer: The views expressed in this article are those of the writer and are not necessarily shared by Moonstone Information Refinery or its sister companies. The information in this article does not constitute investment or financial planning advice that is appropriate for every individual’s needs and circumstances.