The equities-versus-bonds argument is likely to intensify over the course of this year. For many investors, the government bond market is uninteresting after yields spiked, causing pain for those who held them in the post-pandemic cycle.
When comparing stocks and longer-term bonds from a valuation point of view, specifically in the US market, I use Robert Shiller’s PE ratio for the S&P 500 Index. In the case of long-term government bonds, I prefer the real yield of the 20-year treasury bond because of its long duration. The effective duration of the index tracker, iShares 20+ Year Treasury Bond ETF, is about 16 years, and the weighted average maturity – length of time to the repayment of principal – is about 25 years and is there more compatibility to stocks’ payback period of about 20 years (the estimated forward price-to-earnings or PE ratio of the equal-weighted S&P 500 Index).
Due to its more accurate measurement of price pressures and use by bond-market players, the Federal Reserve, and economists, I use the US Consumer Price Index Non-Food Non-Energy to adjust the 20-year bond yield for inflation.
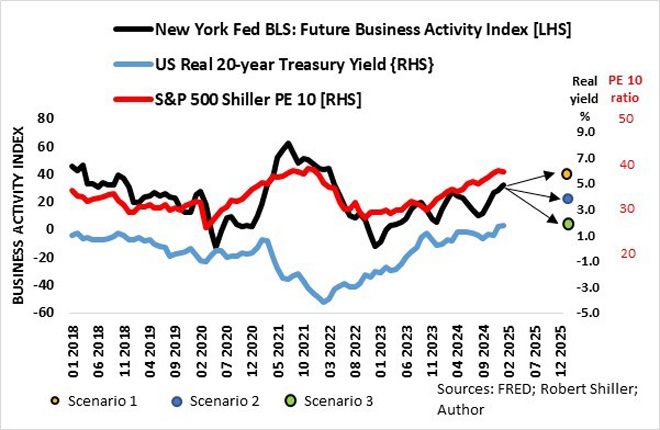
Since 2012, business sentiment, measured by the Federal Reserve Bank of New York’s BLS Future Business Activity Index (FBAI – my abbreviation), drives the valuation of stocks and bonds. Stock market valuations and real bond yields trend higher when business sentiment rises, and vice versa, declines when sentiment sours. The relationship between bonds and the FBAI broke down in 2021, but the relationship resumed afterwards.

It remains unclear what impact President Donald Trump’s policies and tariffs will have on the US economy and therefore on financial markets. At this stage, the only certainty is that there are three probable outcomes over the next 12 months: business sentiment increases markedly (scenario 1: average FBAI over the past 20 years plus 1 standard deviation), remains positive (scenario 2: average FBAI), or pulls back sharply (scenario 3: average FBAI minus 1 standard deviation).
By assuming that the historical relationships will continue, it is possible to get an indication of how the two major investment markets will react in the three abovementioned scenarios. The outlook for US inflation complicates the calculation of returns, though, specifically that of bonds.

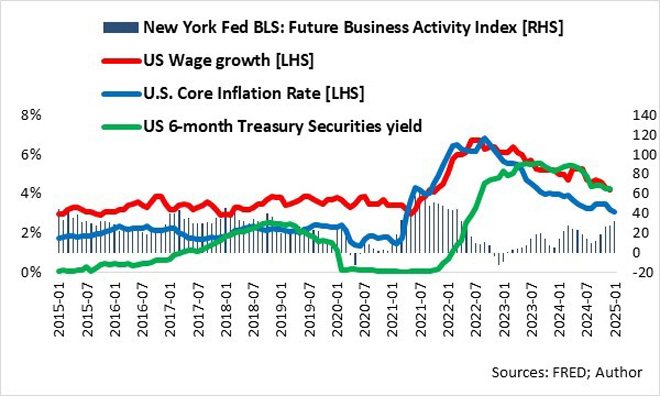
At this stage, it is evident that the Federal Open Market Committee is targeting year-on-year US wage growth in its interest rate policy and will continue to do so until the core inflation rate declines to about 2.5%, unless other unforeseen factors come to the fore. The CPI metric that the Fed follows indicates that the current underlying inflation rate is closer to 2.5%. But for all practical purposes, I used core CPI inflation of 3% on a year-on-year basis and returns 12 months, hence income (dividends and interest) not reinvested.
Probable outcomes:
Scenario 1: The S&P 500’s PE 10 could go beyond 40+ (currently 37.5), with the market returning more than 10%. Real 20-year bond yields could increase to 2.0% from about 1.7%, and the nominal bond rate is unchanged at about 5%, returning about 4%.
Scenario 2: The S&P 500’s PE 10 could fall below 35 and even lower, with negative returns of up to 10%. Real 20-year bond yields could fall below 1.5%, the nominal bond rate is below 4.5%, returning more than 10%.
Scenario 3: The S&P 500’s PE 10 could fall below 30, with negative returns of up to 20%. Real 20-year bond yields could fall below 0%, the nominal bond rate goes to 3%, returning up to 30%.
From the above, it is evident that US bonds as an asset class are likely to protect my total US investments if Trump’s policies and tariffs have a negative and a lasting impact on the broad US economy. If inflation comes in hotter, bonds may just bear the brunt, but the impact on the stock market could be disastrous because risk-free rates will soar.
Fortunately, I can reduce the downside risk in the bond portfolio by cutting the duration of the bond portfolio by giving up potential returns if bond yields fall but also lower potential losses when bond yields rise, specifically if US inflation spikes, but still get about the same income yield across the US yield curve.
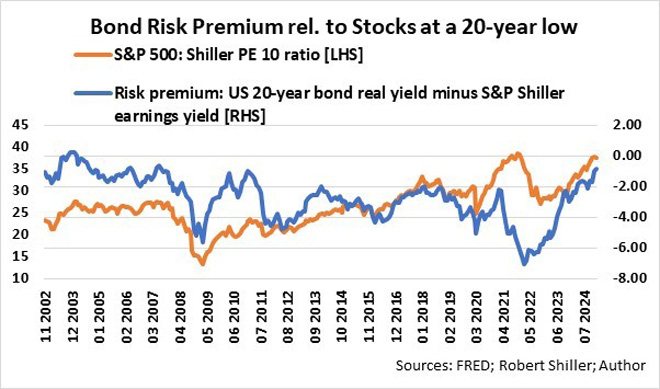
The risk premium of US bonds relative to US equities is at a 20-year low.

When comparing stocks versus longer-term bonds, specifically in the US market, I prefer to look at what real yields bonds offer compared to stocks. In the case of stocks, I define the real yield of the S&P 500 Index as the inverse of Robert Shiller’s PE 10 ratio, effectively the real earnings yield or Shiller earnings yield. I subtract the US 20-year treasury bond real yield (as defined above) from the S&P 500 Shiller earnings yield to obtain the effective risk premium of US long-term bonds relative to the US stock market (S&P 500).
Yes, the dead asset is about to come alive again! From a return/risk point of view, bonds, especially medium-dated bonds, are an essential asset in my total investment portfolio.
Ryk de Klerk is an independent investment analyst.
Disclaimer: The views expressed in this article are those of the writer and are not necessarily shared by Moonstone Information Refinery or its sister companies. The information in this article does not constitute investment or financial planning advice that is appropriate for every individual’s needs and circumstances.


